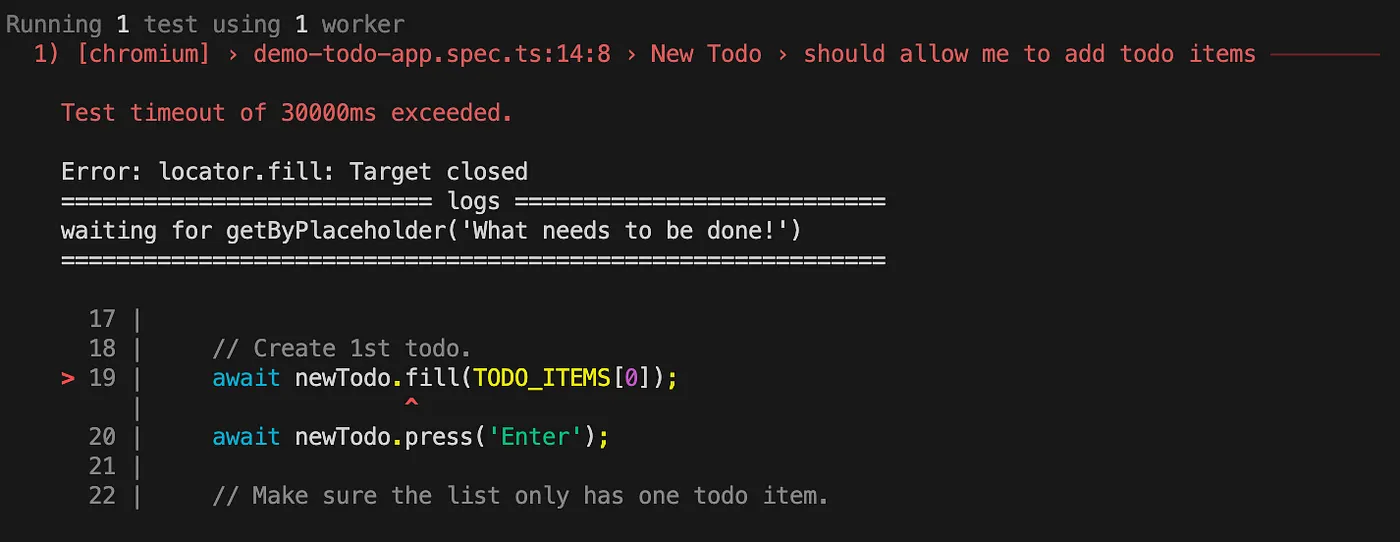
Let’s examine a common error in test automation: “Test timeout exceeded.” If we know that this test was executed successfully in the past and is now failing with a timeout error, we can assume that there was an error with executing one action inside the test because the element was not found. The error message indicates that the error occurred at action locator.fill and the line of code is 19.
There are several tools that we can use to debug tests:
- Headed mode execution
- Verbose API logs
- Browser Developer Tools
- Playwright Inspector
- VS Code extension
- Trace Viewer
- UI mode
Headed mode execution
Running tests in headed mode and watching the UI during execution can provide clues as to what is going on. Although it may not seem like much help, defining headed mode by starting the browser with options can be useful in this regard.
// Chromium, Firefox, or WebKit
await chromium.launch({ headless: false, slowMo: 100 });
Setting headed mode can be done in the Playwright config file or by starting the browser with argument headed.
npx playwright test --headed
After execution, Playwright generates a console and HTML report, depending on the configuration. If an error occurred while something was displayed in the UI, a screenshot is generated at the moment when the issue occurred. This still doesn’t provide much help, as it suggests an issue with the action fill. A better error message in this case would be the one usually seen in Selenium: “element not found”.
Verbose API logs
One of the features that make Playwright so popular is its auto-waiting on elements.
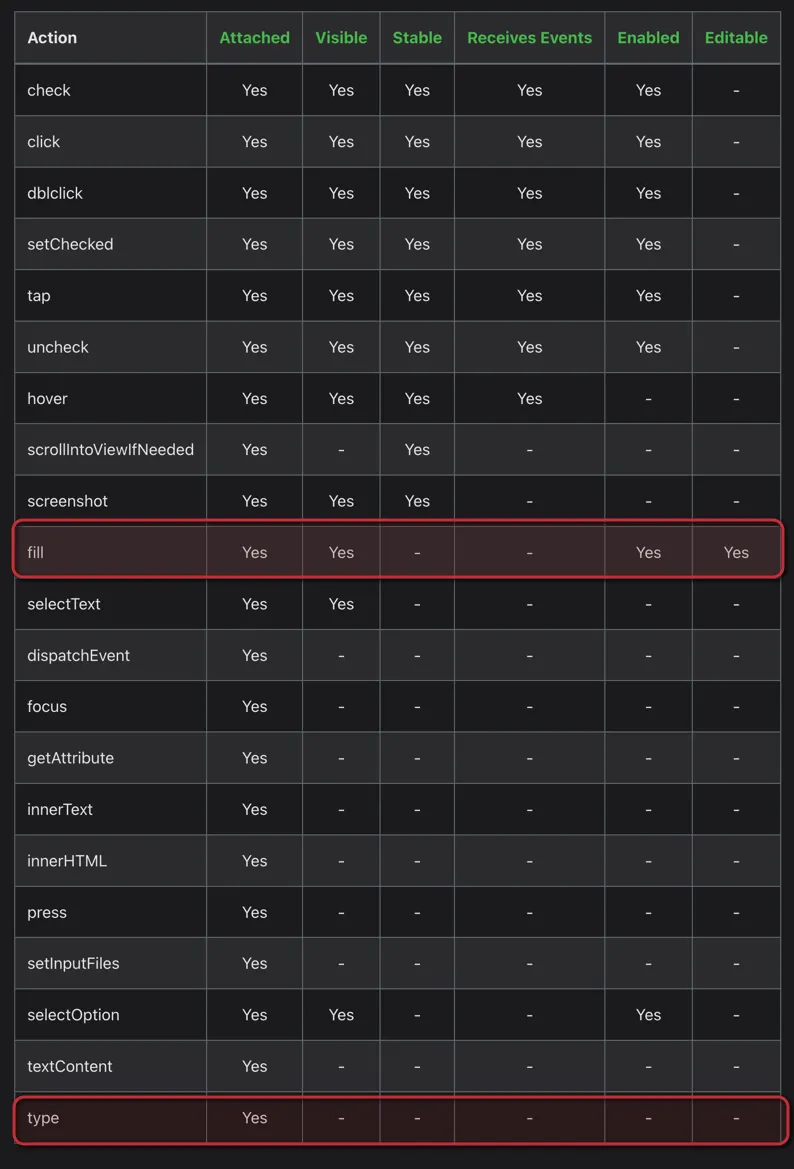
In practice, this means that some checks will be executed before an action is done. For example, for the “locator.fill” action, the following actionability checks are executed: attached, visible, enabled, and editable. If you compare this action with “locator.type”, you will see that only the “attached” actionability check is executed before typing. This can influence our decision on which action to use.
During the execution of tests, we don’t see these actions executed in terminal, but the good thing is that we can enable them.
To enable actionability logs, set the environment variable DEBUG to the value “pw:api”. This can be done either during execution or set for every call.
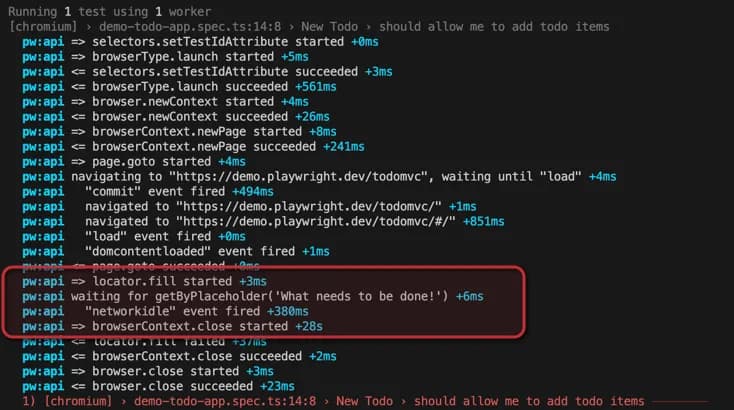
DEBUG=pw:api npx playwright testWe can now see checks in the console. For our locator.fill method, we can track that Playwright started the action, waited for the element with the selector getByPlaceholder(‘What needs to be done!’), and then began the teardown process.
Based on this information, we can assume that either the element is not attached or our selector is not correct.
Browser Developer Tools
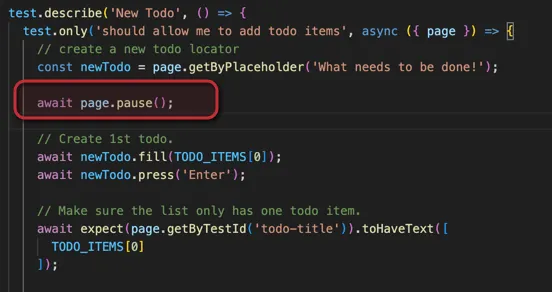
We have identified an issue with the action locator.fill, which is defined in our script at code line 19. To continue debugging this script, we can add await page.pause() before the action. As the name suggests, this action will pause the script at the desired position, allowing us to inspect and debug the issue.
Before we begin debugging, it’s worth noting that there is another environment variable that enables debugging inside the Browser Developer Tools Console. Set PWDEBUG to the value “console” or simply run the tests using the following command:
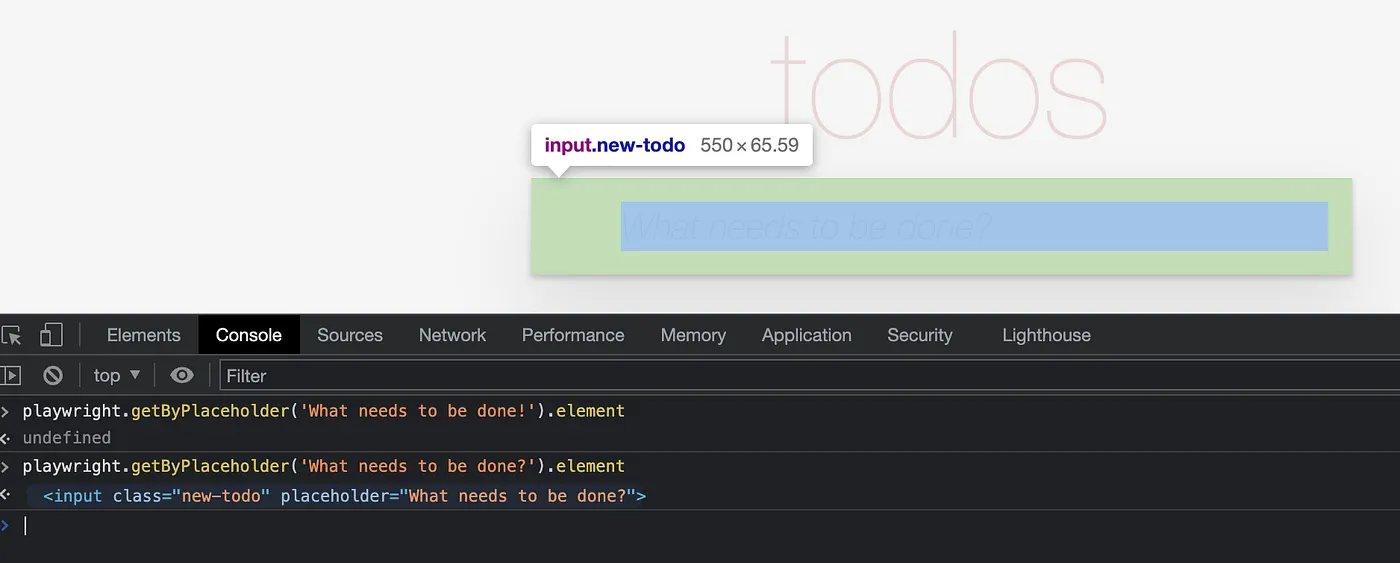
PWDEBUG=console npx playwright test --project=chromiumBy using this variable, Playwright loads the script inside the browser and exposes the Playwright object in the console. We can access the same methods we use in our script for writing selectors by calling the playwright instance. In our example, we tried to identify an element with .getByPlaceholder(‘What needs to be done!’). We can use this method inside the browser console to inspect the selector.
However, calling playwright.getByPlaceholder(‘What needs to be done!’).element inside the browser console returns an undefined object. This indicates that our selector cannot find our element with this selector. By inspecting the DOM and checking the placeholder for our element, we can see that the placeholder we are using has a question mark at the end instead of an exclamation mark.
This issue has been simplified to illustrate how you can proceed with debugging tests. Errors like this can occur due to typos or changes in the application. When writing selectors, you can chain them to narrow down to a specific one and avoid strict check violations. Further improvements could involve the use of test-ids, which make tests more resilient to UI changes.
Playwright inspector
By using the page.pause() action within our script, we have triggered the start of another tool that is helpful for debugging, Playwright inspector.
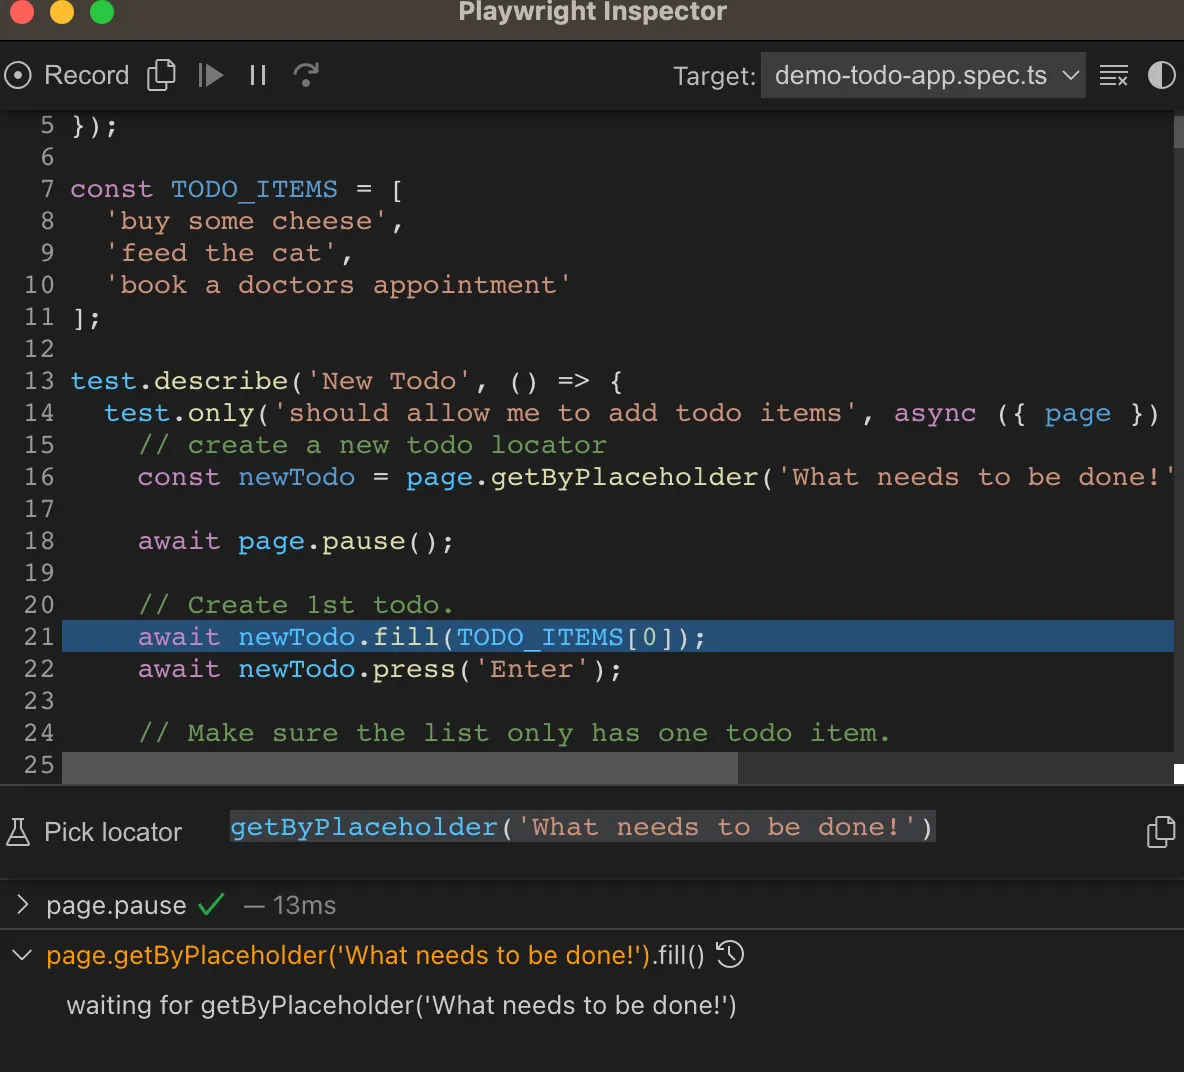
When running tests with Playwright, it is possible to pause them at a specified position and use the Playwright inspector tool. This tool appears in its own window, alongside the browser controlled by Playwright.
One useful feature of the Playwright inspector is the element at the bottom that shows all executed actions. These actions are the same ones described in the Verbose API logs section of the terminal output. If we notice that our selector is hanging and waiting for an element, we can click on the “Pick locator” button to get the correct one.
Alternative way to start the Playwright inspector is to simply add the --debug argument to the command:
npx playwright test --project=chromium --debugThis allows us to see the Playwright inspector before the tests run, so we can either start the execution or step through the script one by one.
VS Code extension
Playwright provides an official VS Code extension that helps set up the environment, write tests, and, most importantly, debug.
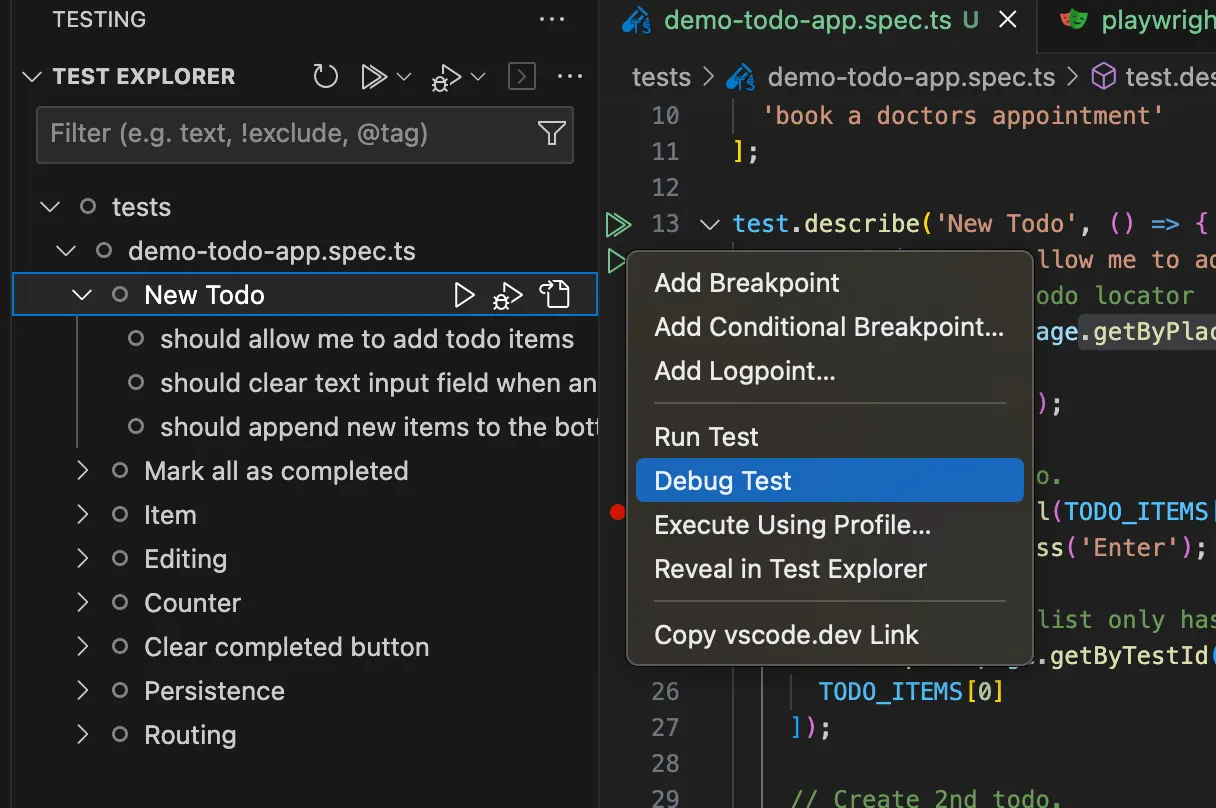
Once the VS Code extension is installed, you will see a button on the left panel. Clicking on this button will open the test explorer, where all the tests are loaded. If you have issues with loading tests into the test explorer, clicking on the reload button sometimes helps to load them correctly. VS Code loads tests from the location defined in testDir from the playwright configuration. Make sure your tests are in the right place.
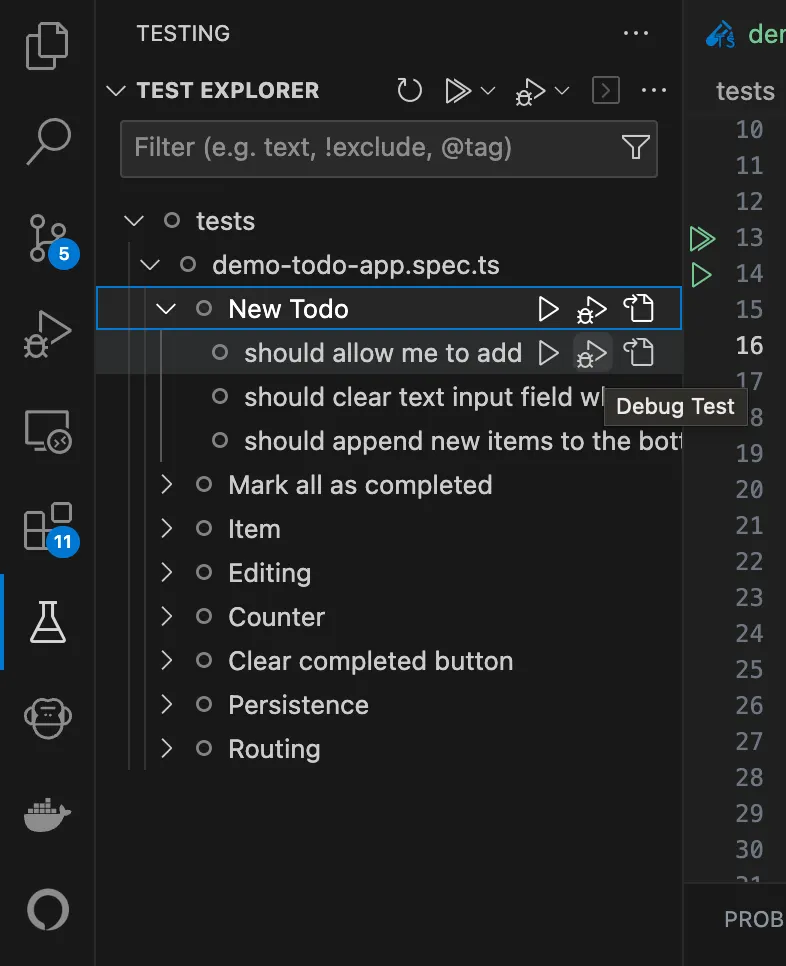
In a file containing the code, near every test, you will see a play button. Clicking on this button will start the test. With a right-click, a context menu appears with more options, one of which is to debug the test. Instead of writing page.pause(), set a breakpoint before the line you want to inspect. The VS Code extension highlights the current line being executed and provides actionability logs. If the test is hanging on the locator.fill() action, you will see “waiting…” inside the highlighted code line, which is the same information you can see using terminal Verbose API logs or actionability logs inside the playwright inspector.
Trace viewer
Trace viewer is a tool that helps us inspect the recorded execution of tests. By default, this report is not generated, and we need to specify when it should be created and to what extent.
The simplest way to record a trace during test execution is to use the trace argument with the value of on.
npx playwright test --project=chromium --trace onOnce the trace.zip file is generated, we can view this report in an HTML page using the following command:
npx playwright show-trace trace.zipIf you have issues starting the trace.zip file, you might need to specify the full path to the file. By default, trace.zip is saved inside the test-results folder.
Instead of starting this trace view locally, you can go to https://trace.playwright.dev/ and select the file that you have generated. The data saved inside the trace.zip file is not transferred to the server; it is processed locally in your browser. This way, you can add reports from CI and generate a URL available for inspection. Here is an example: https://trace.playwright.dev/?trace=https://demo.playwright.dev/reports/todomvc/data/cb0fa77ebd9487a5c899f3ae65a7ffdbac681182.zip
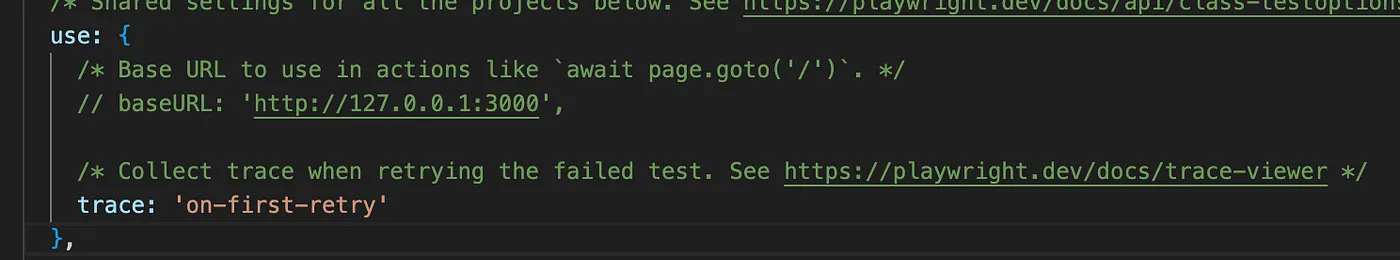
Instead of just turning the trace on, there are other options available:
- 'on-first-retry' - Record a trace only when retrying a test for the first time.
- 'on-all-retries' - Record traces for all test retries.
- 'off' - Do not record a trace.
- 'on' - Record a trace for each test (not recommended as it's performance-heavy).
- 'retain-on-failure' - Record a trace for each test, but remove it from successful test runs.
These types of reports can take up a lot of space on your disk drive, so it is best to optimize them for the purpose of debugging when tests are failing.
The trace option can be defined in the global configuration file or inside a test file by setting values in the test.use method.
More information on how to record and view trace reports can be found at official documentation page https://playwright.dev/docs/trace-viewer
UI mode
If you’ve been following recent releases of Playwright, you may have noticed a powerful new tool for running and debugging called UI mode, which has been available since version 1.32. This tool combines some features from the VS Code extension, Playwright inspector, and most importantly, trace view. You can now see trace view being generated live, and starting specific tests is similar to the VS Code extension, but with much better output.
The main components of Playwright’s UI mode are the following: Watch mode, which shows tests on the left side and allows you to monitor and run tests; the filter, which lets you filter tests by tag, browser, or status; the timeline, which generates snapshots of the application that you can view by hovering over them; and the trace view, which is the central element of the window.
In general, we can say that UI mode combines the best features available from other tools into a single window. In my previous experience working with Playwright, I always felt that debugging needed improvement and should be available seamlessly through a single, intuitive tool. I am now very happy that recent developments have provided UI mode, which has already addressed many of the features I have been missing. The only thing I would really like to see is the evaluation of Playwright actions, so I can pause the test at a specific step and execute the action. This has been available only partially through the Browser Console, where you can test your Locators. Making this available in UI mode as well would be a major improvement for me.
To run tests in UI mode, simply enter the following command:
npx playwright test --uiPlaywright provides release videos to showcase new features in new releases. If you are working with Playwright on a regular basis, I recommend watching these videos to stay up to date on the latest features.


